How Your Strain Score Actually Works
9 min read · August 2026 · by Manikanta Sirumalla
How Your Strain Score Actually Works
Recovery tells you how ready you are. Strain answers the other half of the loop: how much did today actually ask of your body? Here's the complete breakdown of how RepTrack computes it: what counts, what doesn't, why a barbell squat and a tempo run can land on the same scale, and the places where we show you a gap instead of inventing a number.
The boundary first: Strain is a training-load signal, not a medical measurement. It estimates the day's physiological cost so you can pair it against Recovery and plan tomorrow. It diagnoses nothing.
One score, two very different kinds of work
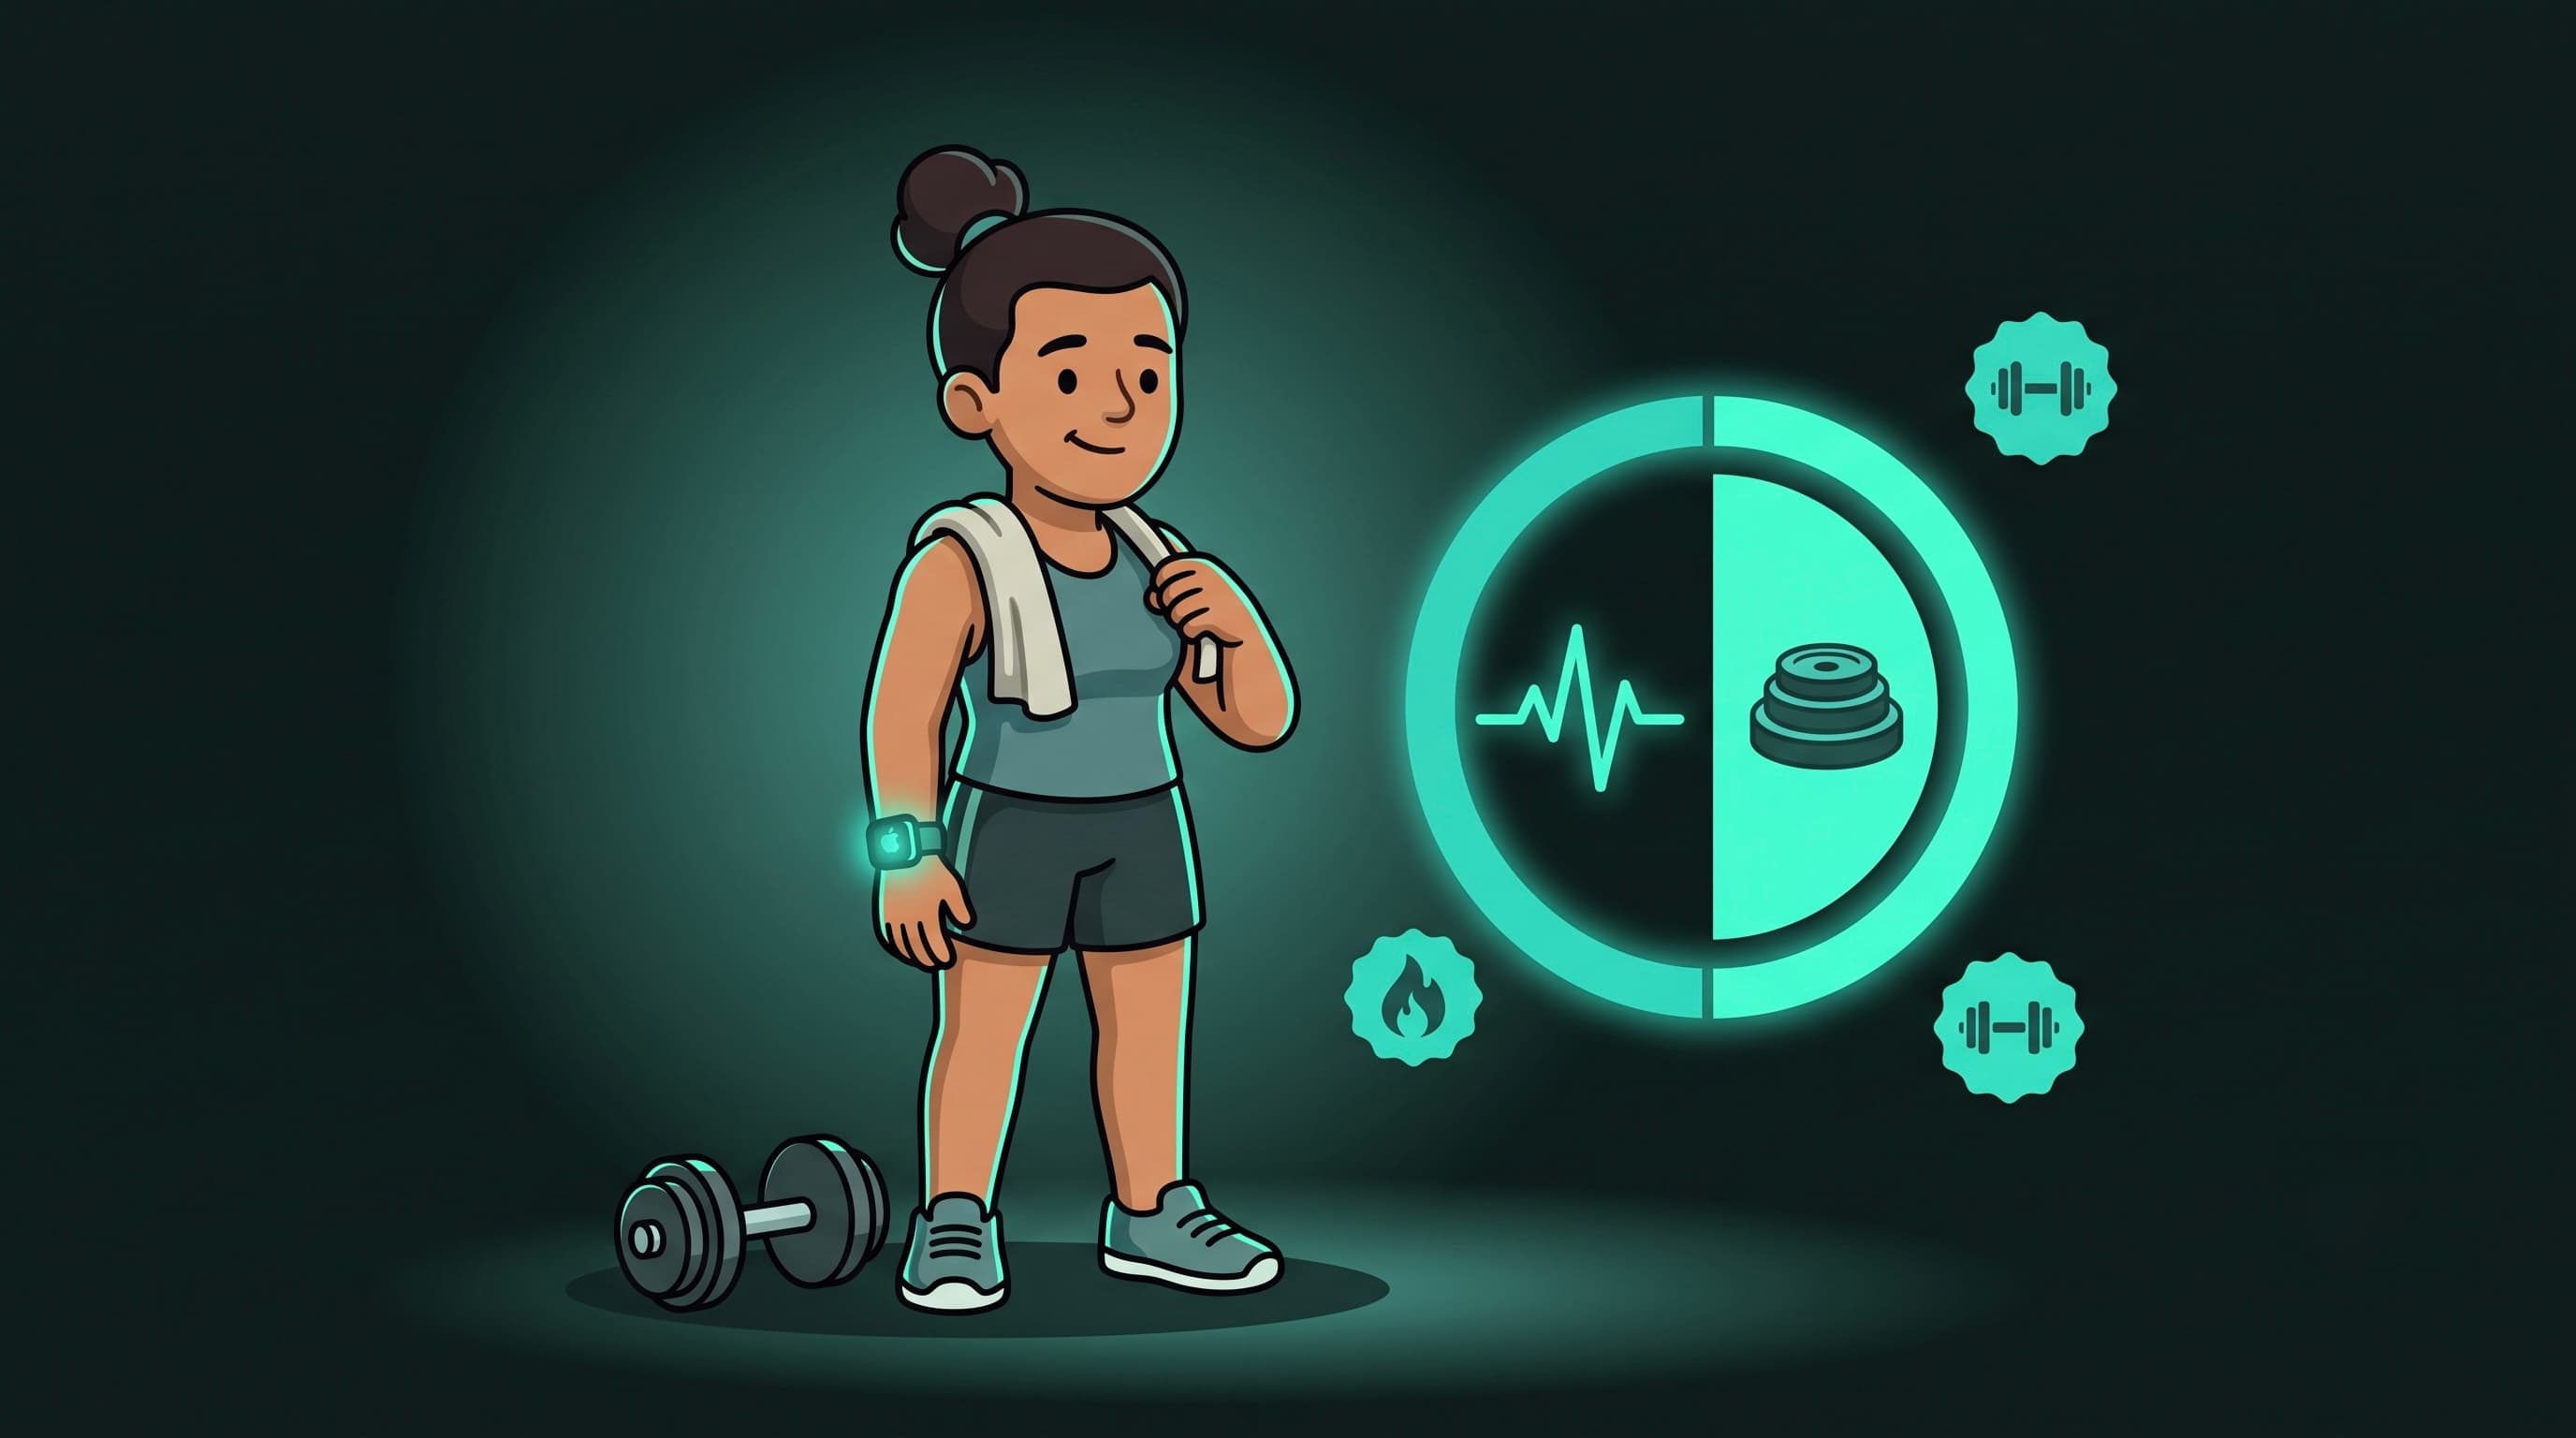
The classic problem with load tracking is that cardio and lifting speak different languages. A 10k run is best described by how hard your heart worked and for how long. A heavy squat session barely moves your average heart rate, yet it can leave you wrecked for two days. Count only one language and half your training disappears.
RepTrack measures both channels for every session and scores the session by whichever is larger, never by adding them together, which would double-count a hard circuit workout where your heart rate and your tonnage were high for the same effort.
The cardio channel: TRIMP
For any session with heart-rate data, RepTrack computes a training impulse (TRIMP): the classic Banister model that exercise science has used for decades. Every minute of the workout is weighted by where your heart rate sat in your personal range:
- First your heart-rate reserve fraction: how far between your resting heart rate and your maximum you were.
- Then an exponential weight on that fraction, so minutes near your max count for far more than minutes of easy jogging. The weighting differs by sex (the published Banister coefficients), because the underlying lactate-response curves do.
This is why 30 minutes at threshold out-scores 60 minutes of strolling: TRIMP measures intensity-weighted time, not just time.
The muscular channel: tonnage that knows what a squat is
For logged lifting, RepTrack computes volume load: weight × reps, summed across your working sets (warm-ups and skipped sets excluded). Two corrections make it honest:
- An effective-mass factor per movement. A set of squats moves most of your body plus the bar; a set of curls moves your forearms. Lower-body and full-body compounds count at 1.00, upper-body compounds at 0.75, isolation work at 0.45. RepTrack classifies each exercise by name using the same movement classifier the plan engine uses, so a deadlift filed under "back" still counts as the full-body pull it is.
- A proximity-to-failure modifier from your logged RPE. Sets at RIR 1 or less count 1.15×, moderate effort (RIR 2–3, or unlogged) counts 1.00×, and clearly submaximal sets (RIR 4+) count 0.85×. Five hard reps and five easy reps are not the same five reps.
The result is converted into the same load units as TRIMP, so the two channels are directly comparable, and the session takes the larger of the two.
No watch, no logged weights? The honest fallback
A logged session with no heart rate and no set data falls back to session-RPE (duration × perceived effort), another decades-old, validated method (Foster et al.). And a day with no signal at all gets no score: never a fake zero, because a rendered 0 claims "you did nothing," which is a lie about a day we simply couldn't see.
Ambient load: your non-workout day counts (a little)
Walking to work, taking stairs, chasing a toddler, none of it is a workout, all of it costs something. RepTrack credits movement outside your sessions from all-day heart rate (or, with no watch, a modest steps-based proxy), capped at a small fixed budget per day. The cap matters: ambient credit exists so an active day reads busier than a couch day, not so errands can impersonate training.
Why 50 means "your typical day"
Raw load numbers are meaningless without context, is 340 TRIMP a lot? For you? So RepTrack normalizes the day against your own trailing 90-day average load and maps it through a saturating curve fixed by one anchor: a typical day for you scores exactly 50.
- Doubling your typical load lands around 75.
- Tripling it lands near 88.
- The curve saturates as it approaches 100, because at some point "more" stops being meaningfully different, the same reason WHOOP's strain scale gets logarithmically harder to climb.
New users without 90 days of history are scored against a population floor until their own average matures, so early scores are usable but conservative, and your scale quietly becomes yours as history accumulates.
The bands
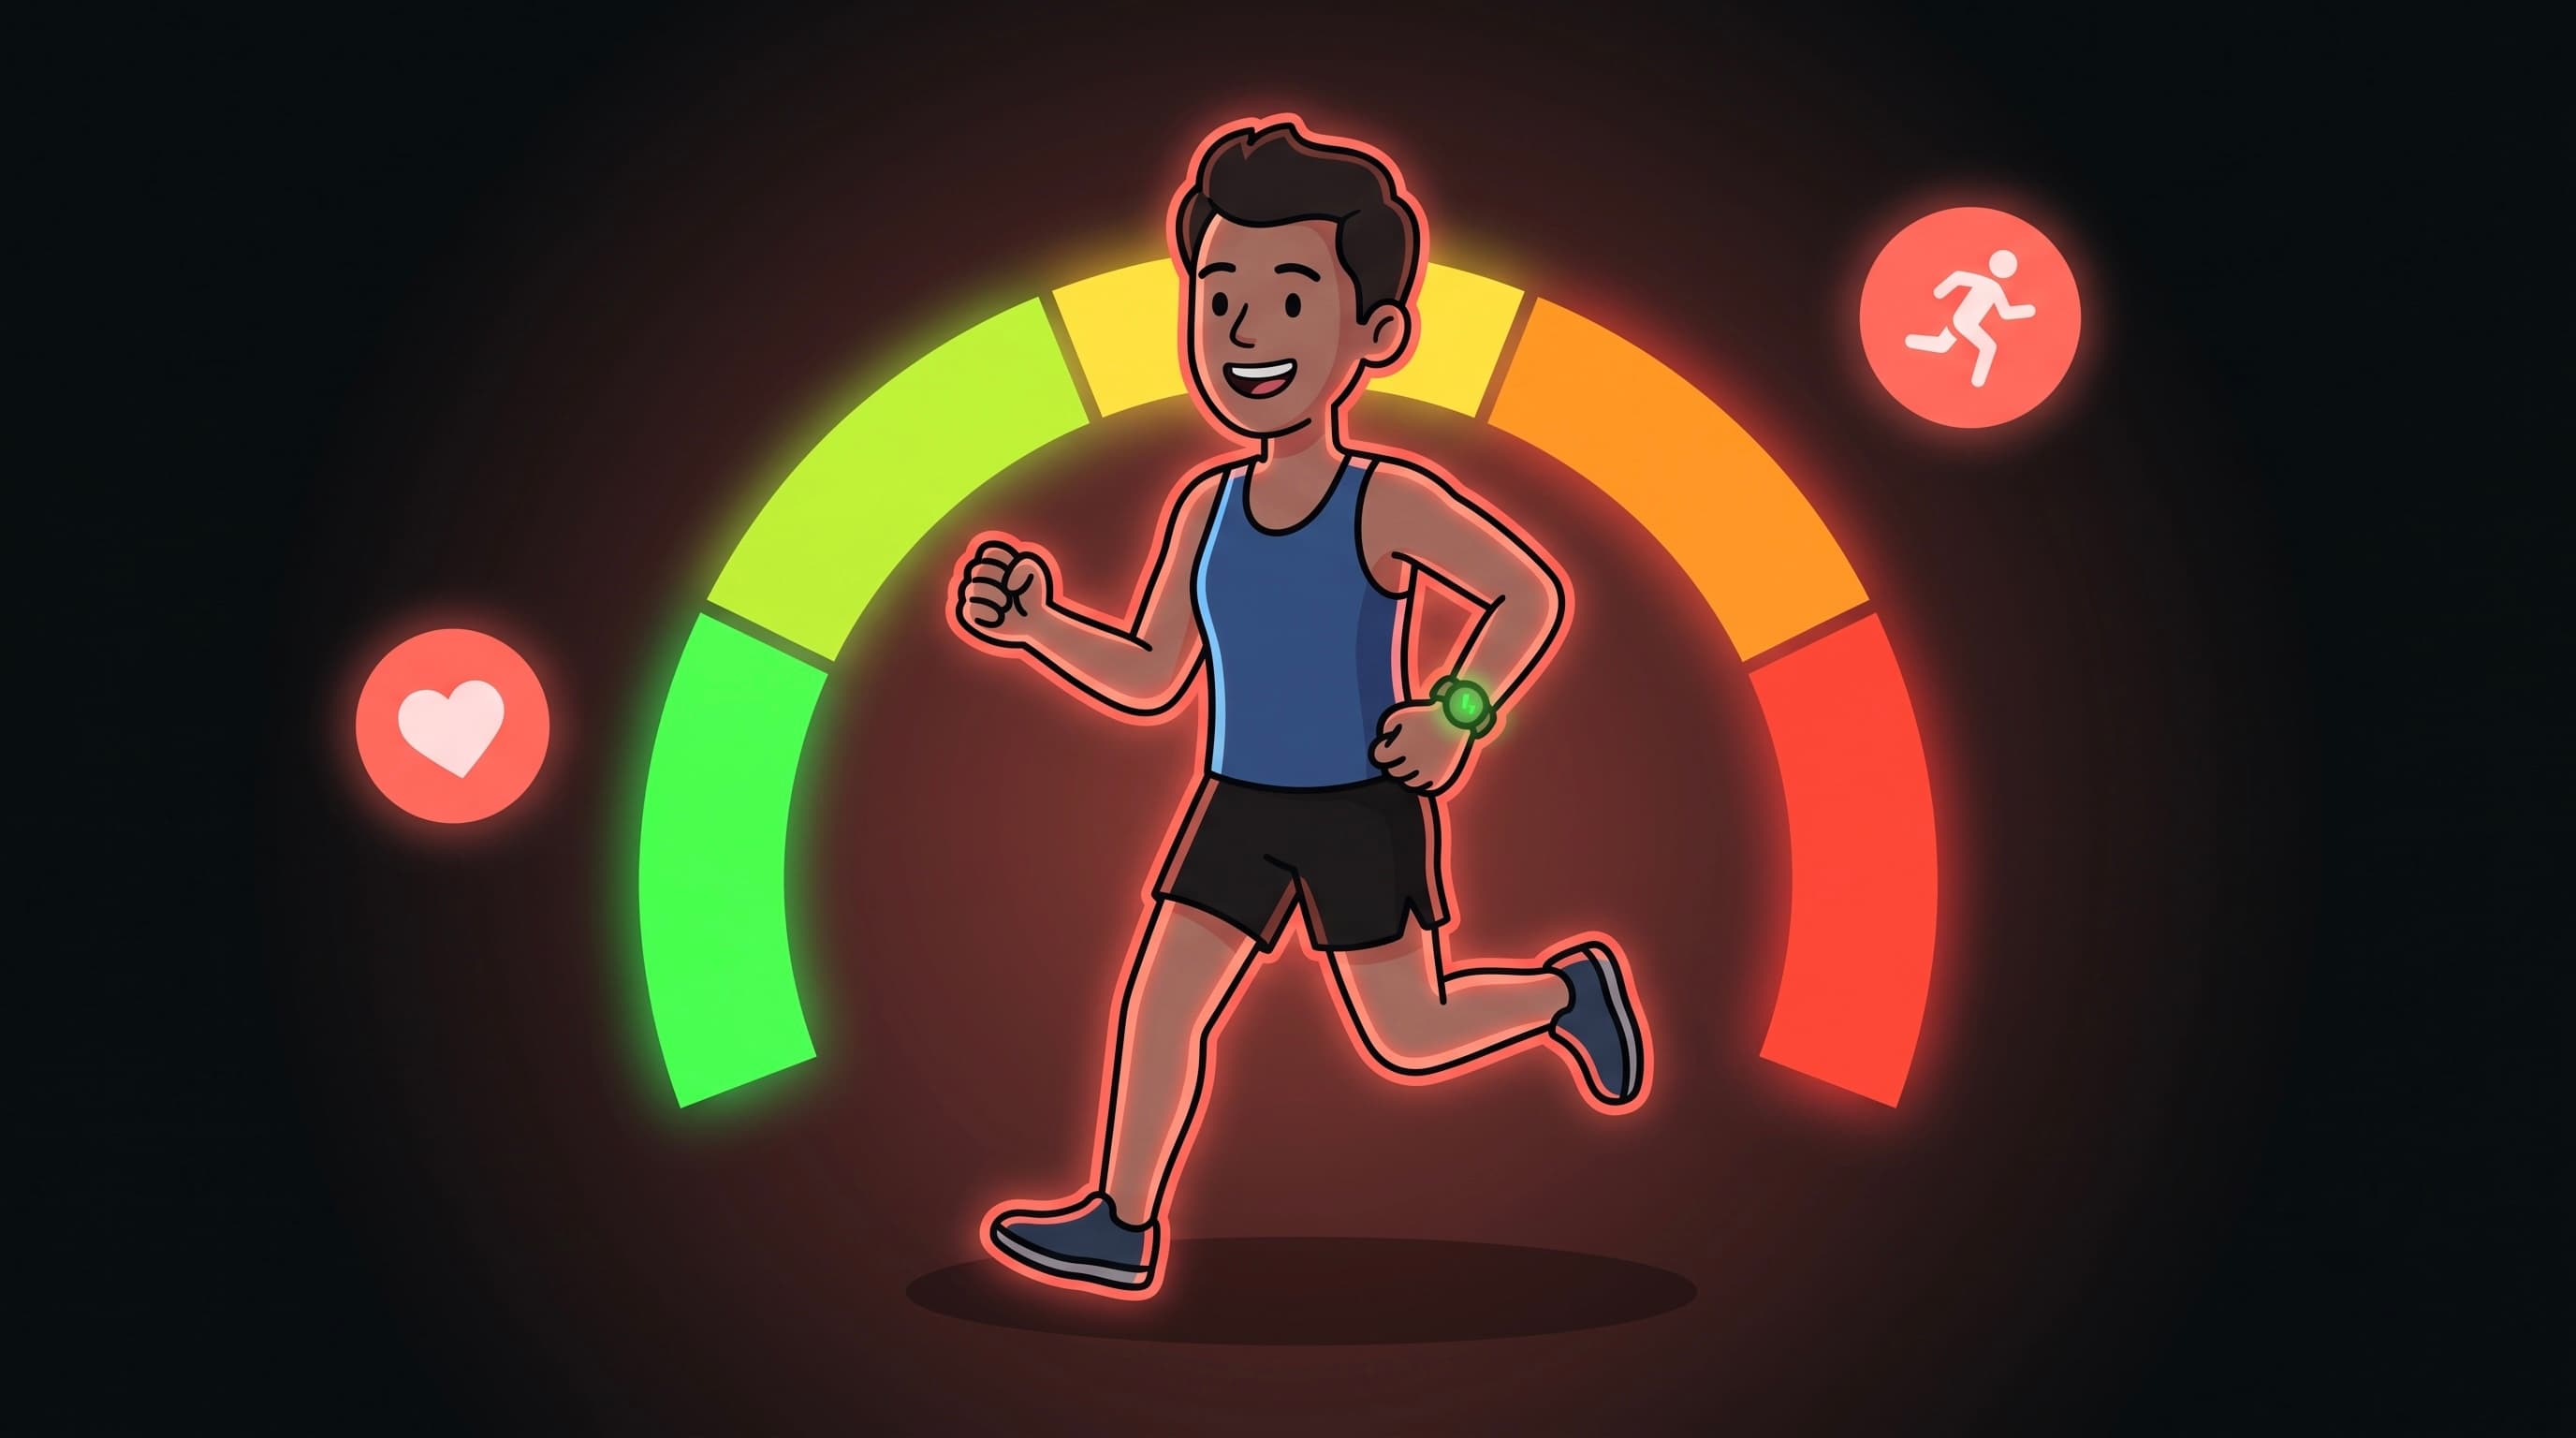
- Light (under 34): an easy day. Deliberately rendered in neutral colors, a light day is rest working as designed, not a deficiency, and RepTrack will never nag you for it.
- Moderate (34–67): a normal-to-solid training day. Your typical day, by construction, sits at 50.
- High (68+): a big day. At 90+ you'll see an "All-out" caption, a flag on the High band, not a fourth band.
Your HRmax: the ladder behind the cardio math
TRIMP needs your maximum heart rate, and "220 minus age" is famously sloppy. RepTrack resolves HRmax through a ladder, best evidence first:
- Your manual override, if you've tested it, it wins outright.
- Otherwise the larger of: the highest heart rate actually observed in your last 12 months of workouts, or the Tanaka estimate (208 − 0.7 × age), which outperforms the 220 formula in the research.
- No age on file and nothing observed? A clearly-labeled assumed 190 with a prompt to complete your profile, used rather than zeroing out your entire cardio channel, and it carries a confidence penalty while it's in effect.
Everything is clamped to a physiological 120–220 range so a corrupt value can never poison the math.
Confidence: how much to trust today's number
Every Strain score ships with a confidence tier built from heart-rate coverage (how much of your waking day actually carried samples, 70%+ for high, 40%+ for medium), whether every logged session had measurable data, and whether the steps proxy or an assumed HRmax had to stand in. A high-confidence 72 is a real "big day." A low-confidence 72 is "probably a big day, thin data." Same number, different conviction.
The honesty contract
Same rules as every RepTrack score:
- No score beats a fake score. A day we couldn't measure shows a gap, not a comfortable-looking number.
- Light is never a warning. No red ink for resting.
- The breakdown is visible. Every session's contribution, cardio or muscular, whichever won, is listed, so you can always audit where the number came from.
How to actually use Strain
- Pair it with Recovery. Green recovery + room on strain = push. Red recovery + yesterday's strain at 80 = today is not the day.
- Watch the week, not the day. One high day is training; five consecutive ones with sinking recovery is a hole you're digging.
- Don't chase the number. Strain measures cost, not virtue. The goal is the right strain for today, not the maximum.
- Log your lifts with RPE. The muscular channel is only as good as your log, sets with real RPE get the effort-corrected credit they earned.
The bottom line
Strain puts cardio and lifting on one scale: intensity-weighted heart-rate work for sessions your heart can describe, effort-corrected tonnage for sessions your log describes better, whichever is larger per session, plus a small capped credit for everyday movement. It's normalized so 50 is your typical day, banded so light days are never shamed, and honest enough to show a gap when the data isn't there. Read it against Recovery and let the pair set your week.
Sources
- Banister EW. "Modeling elite athletic performance." In Physiological Testing of the High-Performance Athlete, 1991, the TRIMP training-impulse model and its exponential heart-rate weighting.
- Foster C, et al. "A new approach to monitoring exercise training." Journal of Strength and Conditioning Research, 2001, session-RPE as a validated load measure.
- Tanaka H, Monahan KD, Seals DR. "Age-predicted maximal heart rate revisited." Journal of the American College of Cardiology, 2001, the 208 − 0.7 × age estimate.
- Haddad M, et al. "Session-RPE method for training load monitoring: validity, ecological usefulness, and influencing factors." Frontiers in Neuroscience, 2017.
- WHOOP Developer Documentation, strain as a logarithmically saturating, personalized exertion scale.
- Gabbett TJ. "The training–injury prevention paradox." British Journal of Sports Medicine, 2016, why multi-day load context matters (and the limits of load ratios).